Monitoring Overview
The analytics tab data is provided to allow a per query-pattern view of the queries passing through the system, as logged with the Log action or with global VDB logging.
Filters
Before analyzing the data, one of several filters can be specified to control what data is viewed:
- Rows: The number of rows to display. Large numbers may reduce the performance of the browser. Note, if using the regex filter for something in a rare query, it may be necessary to set a large number of rows to get the data desired.
- Virtual Database: Drop-down selector of the VDB to filter on
- Catalogs: Drop-down selector of the VDB catalogs to filter on. It is available when any VDB is selected in the Virtual Database filter
- Regex Filter: A filter (done at the Javascript level) to narrow down the queries to observe. The rows must have been returned from the server for this filter to apply.
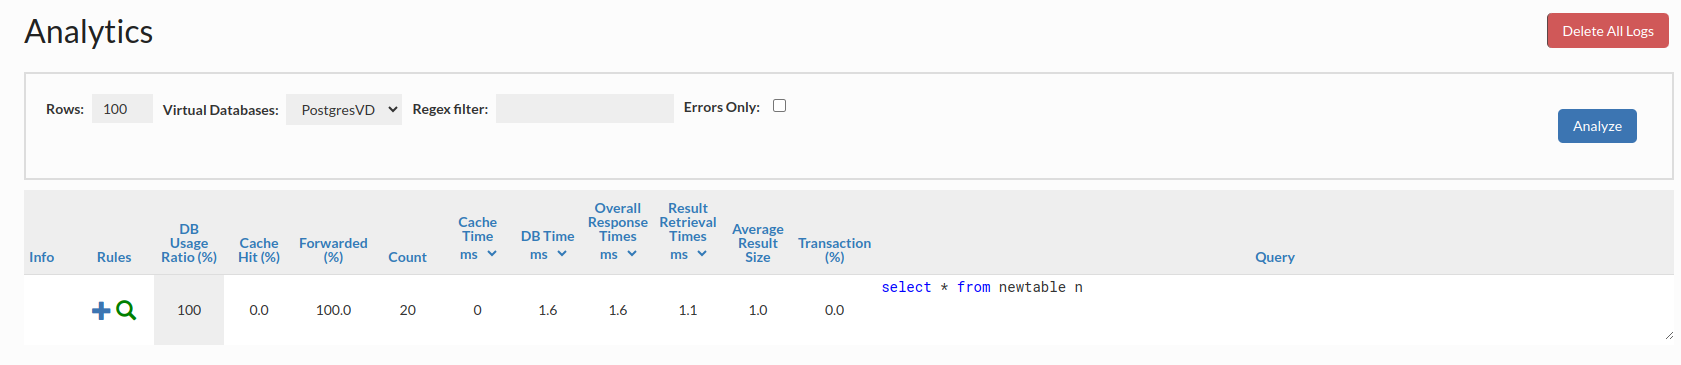
On clicking the Analyze button, the results will be returned, with the following columns:
- Info: This column may show one of several visual indicators. The green page indicates that a Query plan is available to be displayed for the query, and the red circle around an ! indicates that there is an exception registered against this query pattern.
- Rules: Only shown if VDB is picked in Virtual Database field. Provides some information and control over the current rules in effect. The blue + is used to add a new rule based on the query pattern, a green magnifying glass provides a list of rules that match, and the disk icon with a lightning bolt provides an indicator of the cache status of the rule, with green for an explicit regex match, and a red indicating explicit no-cache or a zero ttl.
- DB Usage Ratio (%): The percentage of time overall time waiting on the server represented by this particular query pattern. This column should add to 100% for all queries on a given VDB (rounding excluded).
- Cache Hit (%): The percent of queries a particular query pattern has been served from cache vs. retrieved from the Origin.
- Forwarded (%): The percent of queries a particular query pattern has been forwarded vs. retrieved from the Origin.
- Count: How many times this query pattern has been observed.
- Cache Time: The average time it took for a cache hit to be pulled from the cache
- DB Time: The average time it took for a cache miss to be pulled from the database
- Overall Response Time: The average time it took for all queries to be served to the client, blending the cache hit and miss times
- Result Retrieval Time: Like the Overall Response Time, but measured from the time the query is sent to the server to the time the result-set is closed. This can include additional time spent by the application processing the result-set, and may be significantly longer than the Query Response Time for very large responses.
- Average Result Size: The average result-set retrieval size for this query pattern. Large results generally correlate to larger query times.
- Transaction (%): The percent of time this query pattern was executed in a transaction, i.e. not in auto-commit mode, and/or inside of an explicit transaction. In general, for most applications, this will be 0 or 100%, but in some cases where the same query is executed both inside and outside of a transaction, it may show other values. This can be used to diagnose frameworks that put 100% of queries into a transaction, even when not necessary.
- Query: The query pattern itself. Note--when hovering over the query, a pop-out icon will present itself in the upper right-hand corner, and is used to access the extended query view.
Note: Time units for any appropriate columns can be selected in the display itself, to scale as necessary, so are not documented here.
Extended Query View
Each query, when the mouse is moved over, will provide a small icon in the upper right-hand corner. If selected, extended information may be provided including:
- The query statistics for the query;
- A formatted view of the query;
- The tables detected for this query;
- Any exceptions that have been observed for the query;
- Any saved query plans for this query.
This view is intended to be useful to provide to developers to help diagnose any performance problems that are apparent with the query pattern.
Viewing Errors
The check-box "errors only" will result in a view that only contains queries that have SQL exceptions associated with them.