CloudWatch
When in AWS, and with cloudwatch integration enabled, various KPI indicators are provided to allow monitoring and alerting
Enabling CloudWatch Metrics from Private IP connections
https://docs.aws.amazon.com/AmazonCloudWatch/latest/logs/cloudwatch-logs-and-interface-VPC.html
KPIs
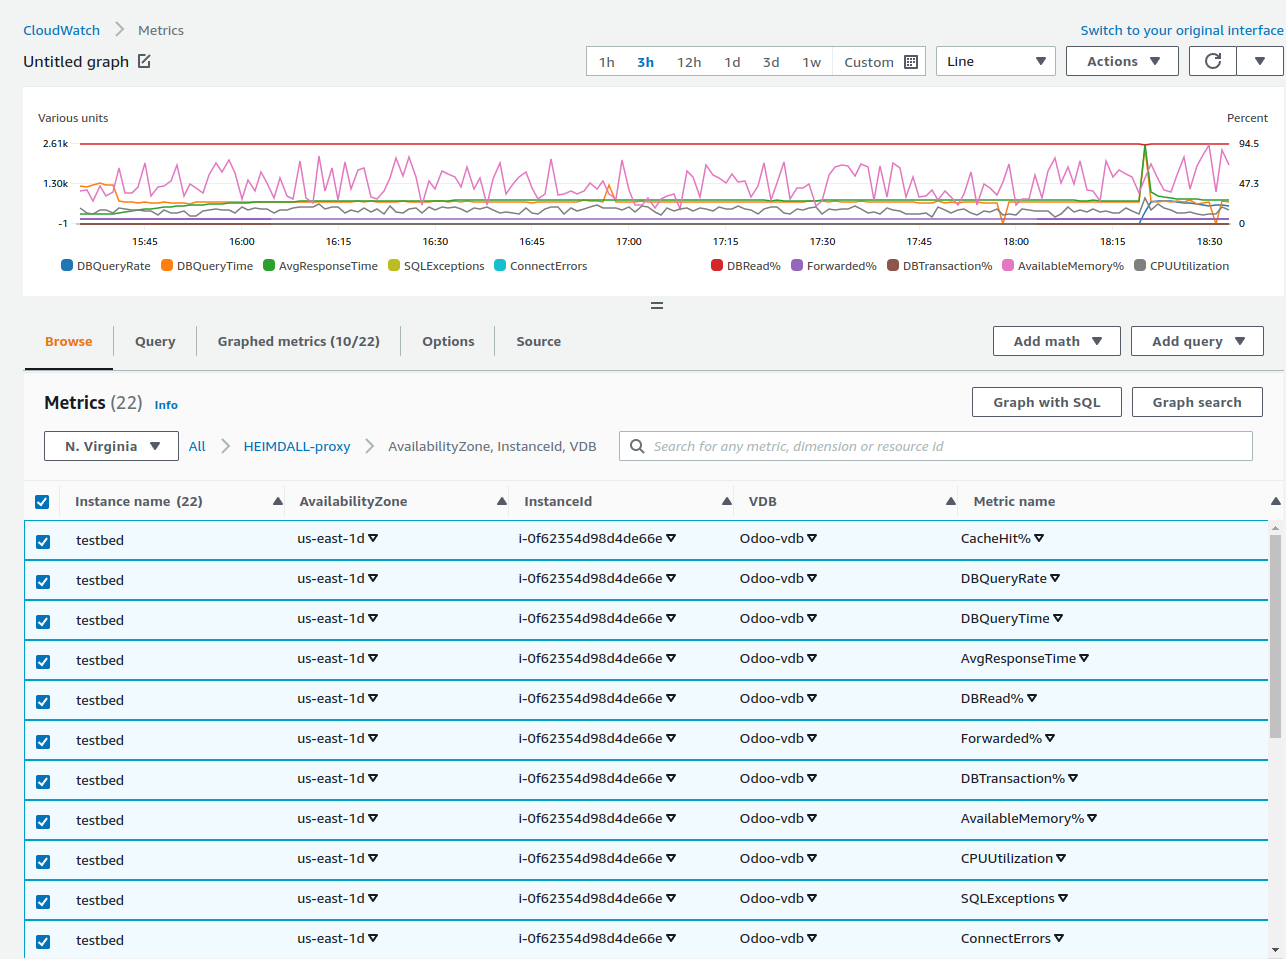
The following metrics are provided:
- Available Memory: The percentage of memory allowed to be allocated by the proxy that is available for use. In general, this can change over time dramatically, but if lower than 20% on average for a five-minute interval, an alert should be generated;
- CPU Usage: The percentage of cpu time used by this proxy. While multiple proxies may make this metric harder to gauge, in a single proxy environment, if this is above 70% for more than five minutes, an alert should be raised;
- DB Transaction Percent: The percentage of queries that are considered to be in transactions;
- Cache Hit Percentage: The percent of queries that are cache hits. This will vary for each customer, but can be used to set an alarm if caching drops below an expected value;
- DB Query Rate: The rate that queries are made against the database, i.e. are not cached;
- DB Query Time: The average response time from the database. This can be used to generate alerts if above the expected SLA;
- Average Response Time: The average response time for all queries, cached or not. This also can be used to generate alerts if above an expected SLA;
- DB Read Percentage: The percent of queries that are reads, which is a pre-requisite for caching or read/write split.
- SQL Exceptions: The number (per second) of SQL exceptions generated as a result of executing queries.
- Connection Errors: The number (per second) of connections errors.
- Forwarded Percent: The percent of queries that are forwarded via a forward rule, or via read/write split. A query may still end up on the writer node depending on configuration however.
Each of these metrics are reported on a per-minute basis, as part of the per-minute logging that is done with other logs to the cloudwatch log channel as well.
A dashboard widget that provides critical CPU usage information with the following query (as of the June 18th build):
SELECT max(CPUUtilization) FROM "<specific proxy CloudWatch namespace>-proxy" GROUP BY AvailabilityZone, VDB
(if no custom namespace is provided, default namespace will be HEIMDALL-proxy)
This will graph per AZ the top CPU using proxy's CPU load on a per-VDB basis. This allows at a glance the ability to spot if a single proxy is receiving too much load due to uneven distribution of traffic, potentially causing issues. Alerts can then be attached to this to notify operations staff of the issue for corrective action.