VDBs
VDB Overview
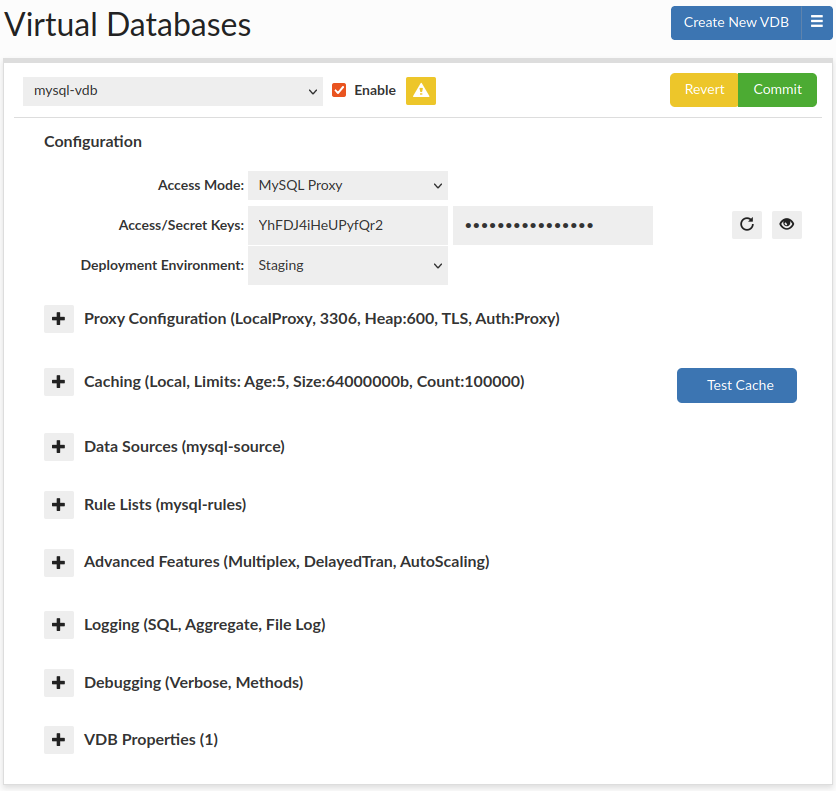
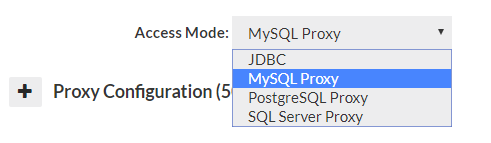
Virtual Databases (VDB) are the basic container for configurations, and aggregate all the settings that will apply to any traffic passed through the VDB. There are two ways to access a VDB, first via JDBC, which supports any JDBC compliant data source, or via a protocol level proxy. In proxy mode, a separate process will be created, and database traffic would be routed through this proxy using a specific port
General configuration options can be found in General Configuration Hint: When using secrets manager, you can point to the same secret as is managed by RDS, so as to reduce the overhead of management. This is useful to ensure that all secrets rotate together based on policy and supports cross region and account management in conjunction with the CF template.
JDBC Configuration
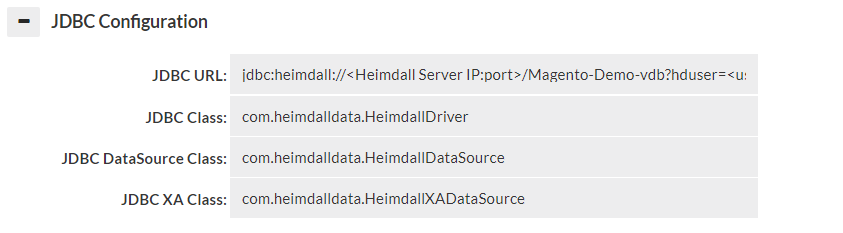
When in JDBC mode, a JDBC URL is provided in the GUI, which is used to configure the application to access the Heimdall Data Access Layer. The JDBC URL is of the format:
JDBC:heimdall://IP:port/{vdb name}?
Optionally, several parameters can be used in conjunction with the Heimdall Connect string:
- hdUser={username}: The username to authenticate against the Heimdall server with.
- hdPassword={password}: The password for the Heimdall server, again overriding the parameter in the data source.
- user={username}: The username to use to authenticate against the database with. If the event the hdUser is not specified, this will ALSO be used as the default hdUser value, in cases where the users on both match.
- password={password}: The password for the database server. In the case where the hdPassword is not specified, this will also be used as the default hdPassword. Note: When using the user and password, the data source credentials will still be used for health checking the application and should have appropriate access for this task.
Note: Typically, only the hdUser and hdPassword is used in the Heimdall JDBC URL, as the data source can provide the user and password options. The ability to specify this here is to allow applications to specify their own username and password, in general to allow many users to access a data source at once.
Proxy Configuration
Proxy mode operates by having the management server either start a process on its own, or having a proxy on a remote system connect. Once started, the proxy will open a port that a client can connect to as if the proxy were the database itself, and access data via that process.
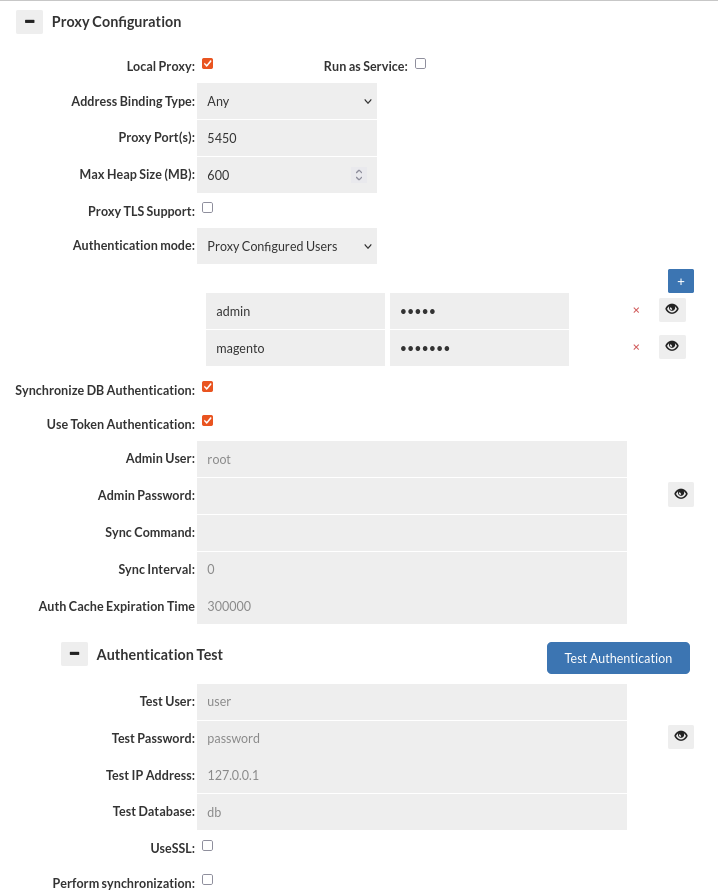
When in proxy mode, several options will be available, two options being required: the address binding type, and the proxy port. The address binding type specifies the behavior of the proxy.
Mentioned options and several other options are available in the proxy configuration: Proxy Configurations options, this list contains all the configurable options regarding Proxy Configuration section.
Authentication Test
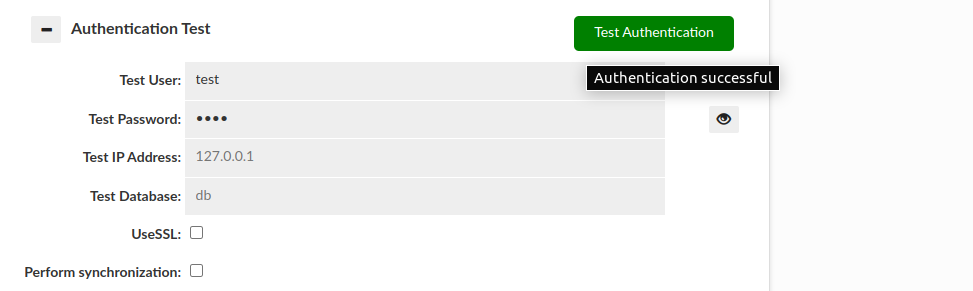
This section allows testing of authentication at the proxy layer. As full SQL based authentication can provide options such as limiting the scope by source IP, what database (these are taken by default from Data Source JDBC URL), or even if you are connecting via SSL or not, this gives a convient UI to determine if an authentication request would pass or fail the proxy layer. Please note--this still requires authentication at the database level, which is not tested via this interface. More details here. Note: The username and password can be stored in the Secrets Manager.
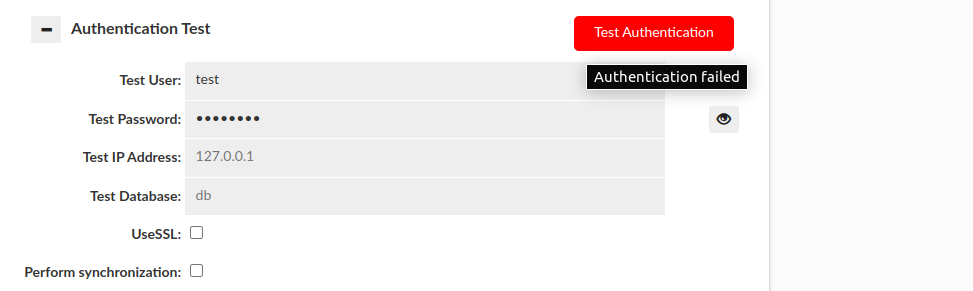
There are two basic results that this test can end with:
Authentication successful:
Authentication failed:
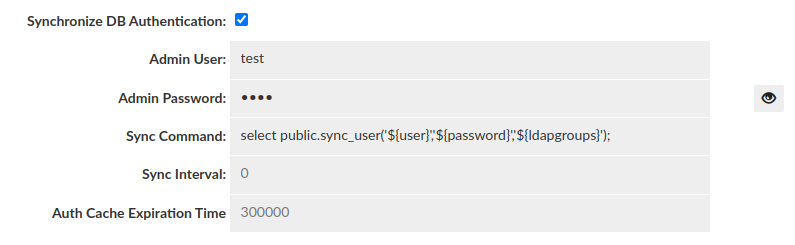
- Perform Synchronization:
This section also allows us to perform synchronization of user and groups on test by enabling "Perform synchronization" (Synchronization query is retrieved from "Synchronize DB Authentication").
Then some more results can be observed:
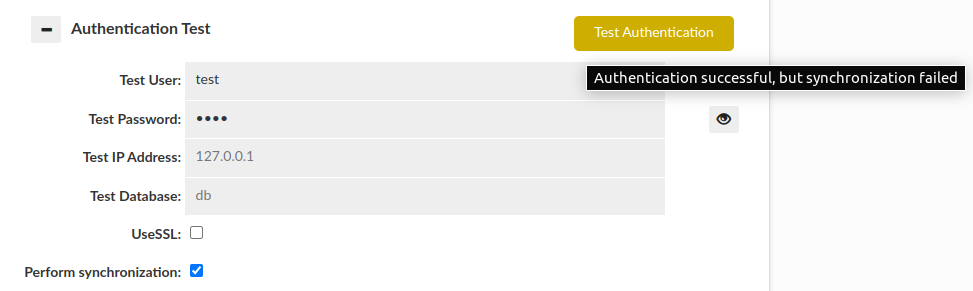
Please be aware that if JDBC URL given in the Data Source contains either ${host} or ${database} respectively Test IP Address or Test Database has to be provided. Anyway, in this case if anything is wrong with the configuration, the additional information will be provided as a hover to the button.
Caching
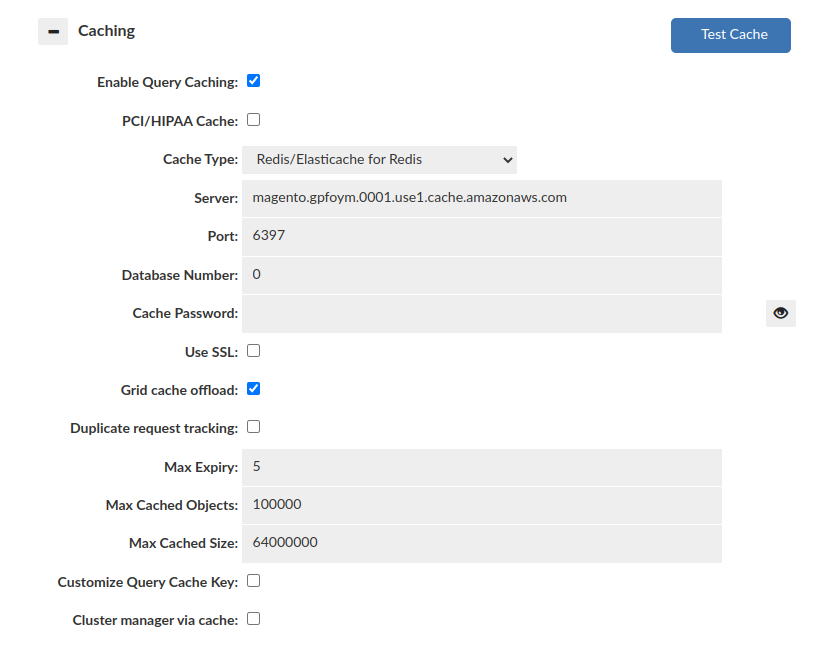
This set of options configures the base cache used by a given VDB. There can be only one cache per VDB at any time, and if the cache settings for a given type are to be changed at runtime, it is required that the cache be disabled first, then enabled again with the new settings. This will allow the cache to be completely torn down, and reinitialized, allowing the entire type of cache to be changed without application restart.
List of configurable VDB caching options: Caching
Note: With Amazon’s AWS Elasticache service, the Redis parameter group option of “notify-keyspace-events” should be set to the value of “AE” in order to optimize cache behavior. This will also be instructed in the log output. For non-Elasticache Redis servers, this option will be configured automatically.
Note 2: Memory allocation for cache is dynamically controlled based on free space allocated to heap. Use the VDB setting of "xmx" to adjust this (in vdb properties). It defaults to target about 1GB of total memory used by the proxy process.
Test cache: The "Test Cache" button allows the user to verify whether a cache connection can be established. Additionally, it checks if key tracking is enabled. If key tracking is not enabled, an alert message will be sent to inform the user about it. After reloading the configuration, make sure to wait for a minimum of 10 seconds as the cache will need to restart. Failing to wait can lead to incorrect test results.
Data Source and Rule List
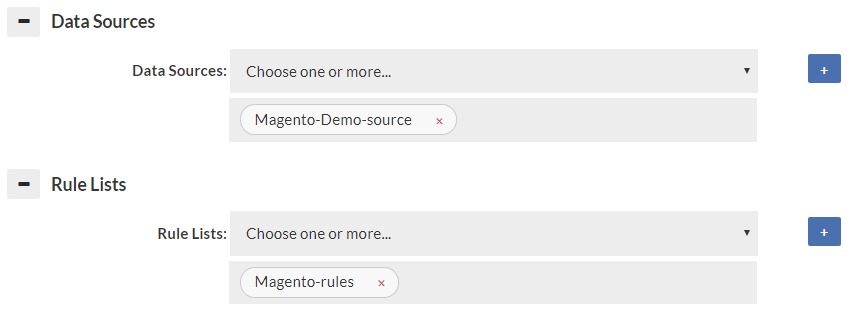
Specify at least one data source, as a default for data to be retrieved from. If a forward policy is specified in the rules for a vdb, it also must be selected here to insure proper connectivity is established to that data source for the forward function to work properly. A connection to the data source will only be established when used if not the primary data source. A reasonable attempt will be made to insure that the data sources for forwarding and read/write split are automatically populated here, but in some rare corner cases (with dynamically generated properties), all data sources will need to be specified here.
Like the data source, the rule list selector configures what rules should be attached to the vdb. If empty, no rule list will be used. All rule lists that are used by the initial (default) rule-list must be specified or they will not be executed. A reasonable attempt will be made to insure that the rules used in "call" actions are automatically populated here, but in some rare corner cases (with dynamically generated properties), all rules will need to be specified here. The log may generate warnings if this is not setup properly.
Note: Only the first rule-list specified will be executed by default. In order for additional rule-lists to be executed, they must be referenced from a rule with an action of call.
Advanced Features
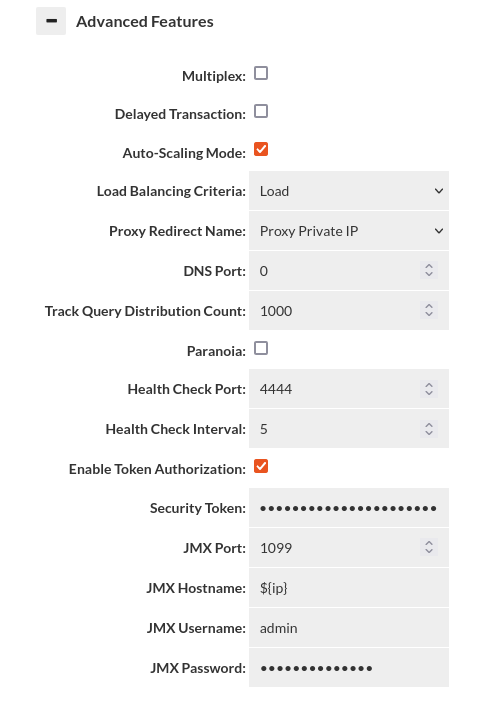
To see all configurable items please see list of Advanced Features.
Multiplex and Delayed Transaction Considerations
- multiplex: Do load balancing to the server at the transaction level vs. the connection level. This can drastically reduce the number of connections being established to the server. Requires connection pooling to avoid a dramatic performance drop, and may have side-effects that break certain apps. Test carefully before using in production. DelayedTransactions and multiplexing can be used together to improve the query distribution for apps that support them. Examples of features that if used can cause application breakage with multiplexing include Postgres's search_path (then user must execute a query with the full path to the table name), and MySQL session variables. Any "state" will effectively be lost between queries that are not in a transaction when this feature is used. With this option, intelligence is applied to pool in the most effective mode, similar to how PGBouncer provides session, transaction and statement level pooling. Unlike PGBouncer however, you don't need to choose one mode, as it will intelligently switch between modes depending on the situation. As an example, if we determine a temporary table is created, it will switch to session level pooling until the table is released, then switch back to statement level pooling. If a prepared statement is created, this will also happen automatically. This provides the best pooling behavior without additional configuration on the user's side.
- delayedTransaction: (proxy only) Delay when a transaction is started until a DML is detected. This is useful when using a framework that does everything in transactions. Rules set to not match in a transaction will operate until a DML is encountered, then will not match until a commit/rollback. There may be other performance benefits on the server side as well depending on server. Test carefully before production use. If Delayed Transactions doesn't work cleanly, specific queries can be cached or forwarded in a transaction with the in-trans flag instead, but care needs to be taken to use this option.
JMX Configuration Hints
In the VDB->Advanced section, there is an option to set the JMX hostname. With JMX, it connects twice--once to the name provided by the tool, such as VisualVM, and a second time using a redirect hostname. The hostname must resolve on redirect or JMX will fail. The default value "${hostname}" will use the configured hostname of the VM. This can also be seen in the status tab for the hostname of each VM.
If the hostname does not resolve in VisualVM, then connections will fail. One way to fix this is to use the hosts file on the VisualVM system, or adjust the hostname so it creates a qualified hostname.
Example: If the hostname resolves to ip-10-0-0-1, but you want ip-10-0-0-1.domain.com, you can configure the hostname field in the VDB to be: ${hostname}.domain.com, so when it redirects, the client will be able to connect properly.
For testing purposes, or with only one proxy with a fixed hostname, you can set an explicit hostname here as well.
Additionally, please disable using TLS on connecting, as this option is not currently supported via configuration, as JMX is a rarely used feature, and only internally to a customer's network.
Auto-Scaling Mode Without an External Load Balancer
If the DNS based autoscaling is to be used without an external LB, a few considerations need to be made. First, the Heimdall system should not have any other processes listening on port 53, including Systemd. Please see your distributions documentation to find how to do this, but it typically requires disabling systemd-resolved, and then setting the NetworkManager to use the legacy DNS behavior. Next, set Heimdall to listen on port 53 for DNS, as inbound DNS requests will use this port. Finally, delegate the shared name you are using as a proxy with an NS record to the Heimdall instances themselves.
As an additional note, with no external load balancer to do draining operations on a transition event, it is highly recommended that the application behavior be tested to ensure that dropped connections will be gracefully re-established. An external LB device can help avoid issues, but even with them, the drain time and max connection lifetime should be in sync to ensure that draining can happen without connection disruption.
Logging
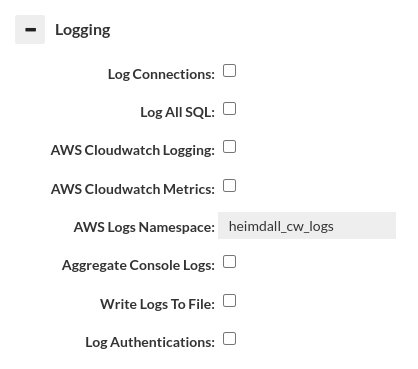
The following log options are available: logging
- Important: When logging SQL, a large amount of data may be generated, and logging can impact the overall performance. To avoid this, you can disable sql logging here, and instead use a log policy with parameters that limit how much data is written. Please see the rules section for details on parameters and the logging section for more details on logging overall.
Debugging

The following debug options are available: debugging
Important: When adding in method logging, for every query generated, it may result in a dozen records for JDBC methods, and with resultset methods, every row will likely have one or more log records. Caution should be observed when using these two log options are used, and should in general only be used in low-volume lab conditions.
VDB Properties
Allows a list of name-value pairs to be used to configure various options, in general per direction from customer support, and for use with test releases to enable a fix. Example:
Vdb configurable properties can be found in: VDB properties