JMX Statistics Overview
JMX statistics describe proxy and its minor features performance. If proxy has healthcheck enabled, JMX metrics associated with specific proxy will be exposed to read.
Endpoints
Healthcheck server handles several types of endpoints:
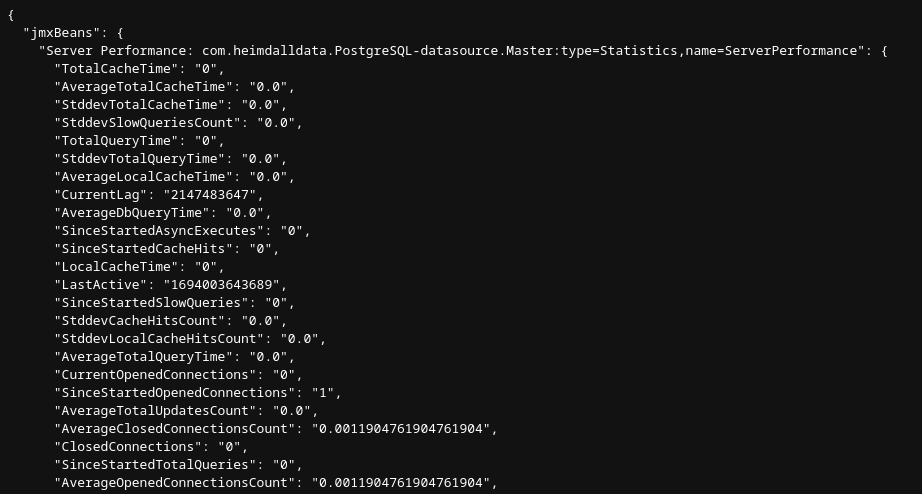
- http://{healthcheck-host}:{healthcheck-port}/jmx - retrieve all JMX statistics associated with specific VDB
- http://{healthcheck-host}:{healthcheck-port}/jmx/{stats-type} - retrieve specific group of JMX statistics (example: /jmx/server-stats will show data source servers performance stats)
- http://{healthcheck-host}:{healthcheck-port}/jmx/{stats-type}/{stat-name} - retrieve specific JMX statistic (example: /jmx/server-stats/SinceStartedSlowQueries will show SinceStartedSlowQueries statistic value for every data source server)
Available JMX Statistics Types
- heimdall-management - general Heimdall statistics (application/proxy)
- data-source-server - data source server configuration basic options
- server-stats - performance metrics for configured data source or multiple data source servers if Load Balancing is used
- connection-pool - connection pool statistics - need to have Connection Pooling enabled
- user-pool - user pool statistics
- jvm - JVM hiccup and heap allocation rates