Debugging Overview
If there are issues that require Heimdall support assistance, please follow the following directions (as appropriate)--please note, most debugging should be done in low-traffic scenarios for best results.
-
If the queries being made are particularly sensitive, enable "paranoia" mode in the vdb->advanced advanced features section (this will hide the actual SQL being generated, so should only be enabled if necessary).
-
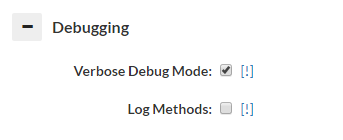
Enable verbose debugging on the VDB experiencing the issue (Note, this will add some extra load on the proxy and central manager, in particular if under high load)
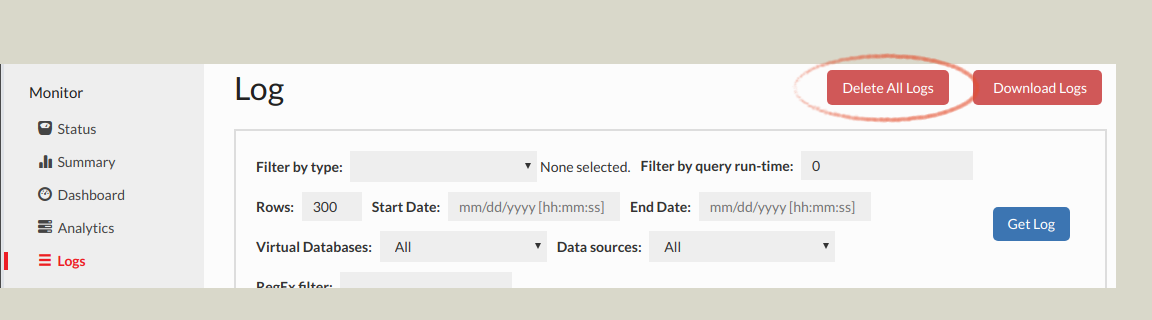
- Delete the logs prior to reproducing the issue:
If a packet trace is requested, please follow one of the next two steps as appropriate:
- On Linux/Mac/Unix systems: If requested, please capture packets on the system the proxy resides on, including the ports for both the proxy port and the port the database resides on.
Using tcpdump (on most Unix-like system):
tcpdump -iany -s0 -wcapture.pcap tcp port <proxy port> or tcp port <database port>
If both ports are the same, i.e. 1433 for SQL Server, then only one port is necessary, i.e.:
tcpdump -iany -s0 -wcapture.pcap tcp port <proxy port>
Note: capture.pcap will be the filename saved--it may be necessary to download this using a tool such as scp, winscp (https://winscp.net/eng/download.php), or filezilla (https://filezilla-project.org/) in order to e-mail this file
-
On Windows: Install Wireshark or a similar packet capture tool (https://www.wireshark.org/download.html) and start a packet capture for the proxy and database ports. Note: If the proxy is on the same system as the application and/or database, then capturing the "loopback" interface is necessary. Please contact support for assistance if necessary with this.
-
Reproduce the problem, preferably with a minimum amount of traffic being generated, and note the time the reproduction was successful, including timezone, to include in the problem report
-
If necessary, terminate the packet capture (CTRL-C for tcpdump, or the stop button in Wireshark)
-
Disable debug mode in the VDB
-
Download the logs from the Log or Analytics tab, and e-mail them and any packet capture generated to Heimdall support, and include a description of the problem, any screenshots that are relevant of the behavior. If the traces or logs are too large (generally ~20MB), please use a file sharing site such as Google Drive or Dropbox to share a link to the files for analysis.
Heap Dumps
At times, if there is a memory utilization issue, Heimdall support may ask for a live or full heap dump of the server or the proxy. Here are the steps to perform this:
- Connect to the Heimdall instance command line as root, typically via Putty or SSH
- use "ps -ef | egrep "heimdallserver.jar|heimdalldriver.jar" to find the pids of the processes
- For a full dump, use the command: "jmap -dump:file=heap-full.hprof
" - For a live dump, use the command: "jmap -dump:live,file=heap-live.hprof
" - Download and provide the files to Heimdall support as appropriate based on size, i.e. via a file transfer site, or e-mail
The difference between a life and full dump is that a live dump only shows objects that are not pending cleanup. Both may be requested, so we can see what memory is being taken by objects yet to be cleaned up.
Stack Trace
If a Heimdall process is getting "stuck" at any point, which could be from a logic deadlock or similar issue, a stack trace can be used to find where in the code the lock is happening. To gather a stack trace, here are the steps:
- Connect to the Heimdall instance command line as root, typically via Putty or SSH
- Use "ps -ef | egrep "heimdallserver.jar|heimdalldriver.jar" to find the pids of the processes
- Use "jstack
> stack.txt" - Download and provide the file to Heimdall support
TCP Keepalive
In order to control idle connections better and prevent NLB timeouts, Heimdall activates TCP keepalives, and sets the keepalive behavior to be one keepalive every 300s while idle. This should be under the 350s that is hard-set for AWS NLB. In other environments, the idle timeout should be set higher than this if keepalive is desired to keep alive connections, and under this value if idle connections should be culled.