Dashboard Overview
The dashboard provides live statistics for many key performance indicators, and can be filtered by VDB. In the case no vdb is selected, then the statistics will be for the resources available to be observed by a user based on their administrative filter, if any.
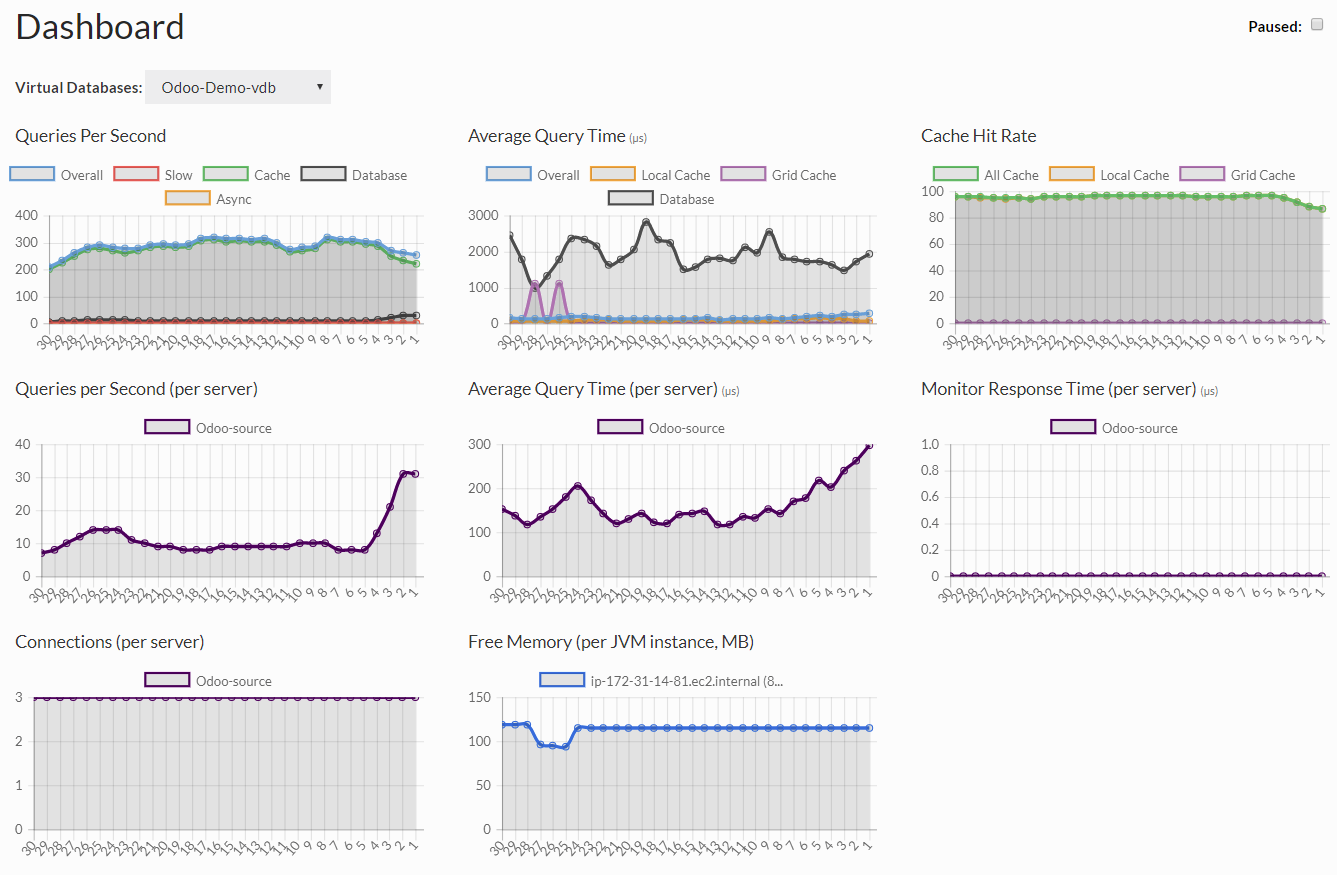
The statistics provided are:
- Queries per second, divided into Overall, Slow (taking longer than 10ms by default), Queries from cache, Database, and Async.
- Average Query time, divided into Overall, Local (L1) cache, Grid (L2) cache, and Database
- Cache Hit rate, divided into Overall, Local Cache, and Grid Cache
- Queries per Second (per Server), showing the overall actual query rate reaching each server
- Average Query time (per server), again showing the average of queries making it to a server
- Monitor response time (per server) showing the monitor query performance, including opening a connection, issuing the query, and closing the connection
- Connections (per server), showing the active or idle connections on each server node at the connection pool (if present) level or actually used.
- Free Memory (per JVM Instance, in MB), the amount of heap available for each node, to help track memory usage issues that may impact caching or the application when in JDBC mode
At the top of the screen, there is a pause button, which will pause rendering of all graphs.
If a particular item is clicked on in the legend of a graph, its visibility can be toggled, so as to help highlight items that may be obscured due to overlapping lines, and/or due to scale issues. The combination of the pause and the item toggle allows each graph to be explored in more detail.